
When I first started making websites, I went looking for web traffic data for other people’s websites in an attempt to set a sort of realistic goal post. I wanted to know: what sort of traffic is realistic for a site that’s just starting out? How will I know if the site is successful or popular? Unfortunately, there isn’t a lot of information available. So, for those that come after me, here’s what my video game site, GameBlaster64, has looked like traffic-wise since day one (January 20, 2011).
My site is not entirely popular, but it’s not barren, either. I post sporadically, maybe once every week on average. The content quality is good, though: all of the posts are original articles, not found anywhere else on the web. I’m always on-topic and share my posts on Facebook, Twitter, G+, and Stumbleupon. I don’t pay for traffic. All of this is organic.
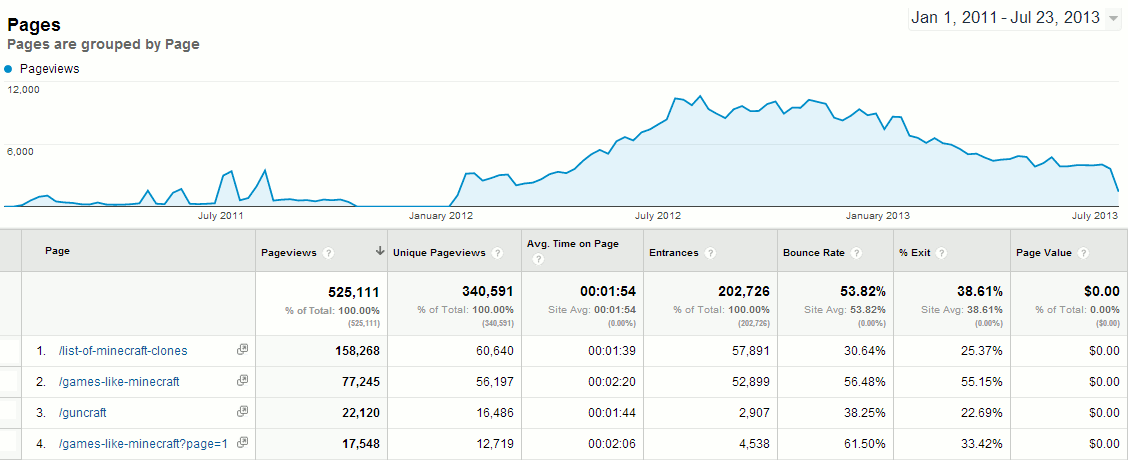
Looking at the data, I find it interesting that although I have hundreds of articles, the ones about popular or trendy topics are right at the top of the popularity chart. Though it’s only one data point, my site’s traffic data seems to support the notion that following trends returns greater interest than long-tail but focused content, i.e., writing things about Minecraft is more popular than covering older/indie/non-mainstream titles or news, even if the latter is much more numerous in post count.
I do run ads from Google AdSense and make some money from Amazon affiliate links, but it’s not enough to quit my day job. Not even close. Still, it pays for our Minecraft server, which is professionally hosted in NYC by the amazing people at Nuclear Fallout. And, I get enjoyment from the creative outlet, covering the industry I love.

